Answer up front: Most individual traders lose money because three compounding forces—leverage and costs, weak or inconsistent edges, and behavioral mistakes under stress—erode small gains over time. Contemporary guidance from U.S. regulators (SEC/FINRA/CFTC) underscores the risks of intraday leverage, margin rules, and pervasive scams; recent international data also show the majority of short-term retail traders lose overall. (SEC, 2025; FINRA, 2024–2025; CFTC, 2024–2025)
Affiliate disclosure (example): If this article links to brokers, charting tools, or courses, those may be affiliate links. We only recommend tools we believe add value. You’re never charged extra.
Table of Contents
Trading attracts smart, motivated people—and yet most still end up negative. Why? In 2024–2025, U.S. regulators renewed attention on day-trading risks, pattern-day-trader (PDT) margin rules, and digital-asset frauds that blur education and marketing (SEC bulletins; FINRA’s review of PDT rules; CFTC advisories on “AI trading bots”). (SEC, 2025; FINRA, 2024–2025; CFTC, 2024–2025) Meanwhile, large-sample evidence outside the U.S. continues to quantify the loss rates for intraday and derivatives trading: India’s market regulator reported that ~70–91% of frequent retail traders lost money in recent years; BIS research documents retail margin traders facing forced unwinds during volatility. (Reuters/SEBI, 2024–2025; BIS, 2024) This article unpacks the structural reasons losses are so common, then gives you a practical, risk-first process to stack the odds in your favor—without hype, and with math you can verify.
What “losing money” means—and why the “90%” meme persists
• “Losing”: Ending a period (e.g., 12 months) with net negative P&L after all costs—commissions, spreads, exchange fees, financing/borrow fees, and taxes.
• Why “90%”? U.S. agencies rarely publish a single loss percentage for “all traders.” But multiple large datasets outside the U.S. consistently show most active retail traders lose money overall, especially in short-term leveraged products. Examples include SEBI’s studies (India) and broker disclosures in CFD markets under ESMA rules; BIS has documented retail margin exposures and stress behaviors. (Reuters/SEBI, 2024–2025; BIS, 2024)
Takeaway: There isn’t a universal, official U.S. “90%” statistic, but the direction is robust: without a durable edge and disciplined risk controls, the majority of frequent retail traders will underperform or lose.
The core mechanics: why small edges get erased
The L.E.A.K. framework (unique, practical lens)
Most traders lose because profits Leak away via Execution frictions, Accounting errors (of risk), and Kahneman-style biases under stress.
1) Leverage & Liquidity (L).
• Leverage magnifies noise. PDT rules require ≥$25,000 equity for pattern day traders in margin accounts; leverage multiplies drawdowns as well as gains. (FINRA Rule 4210; FINRA, 2024–2025)
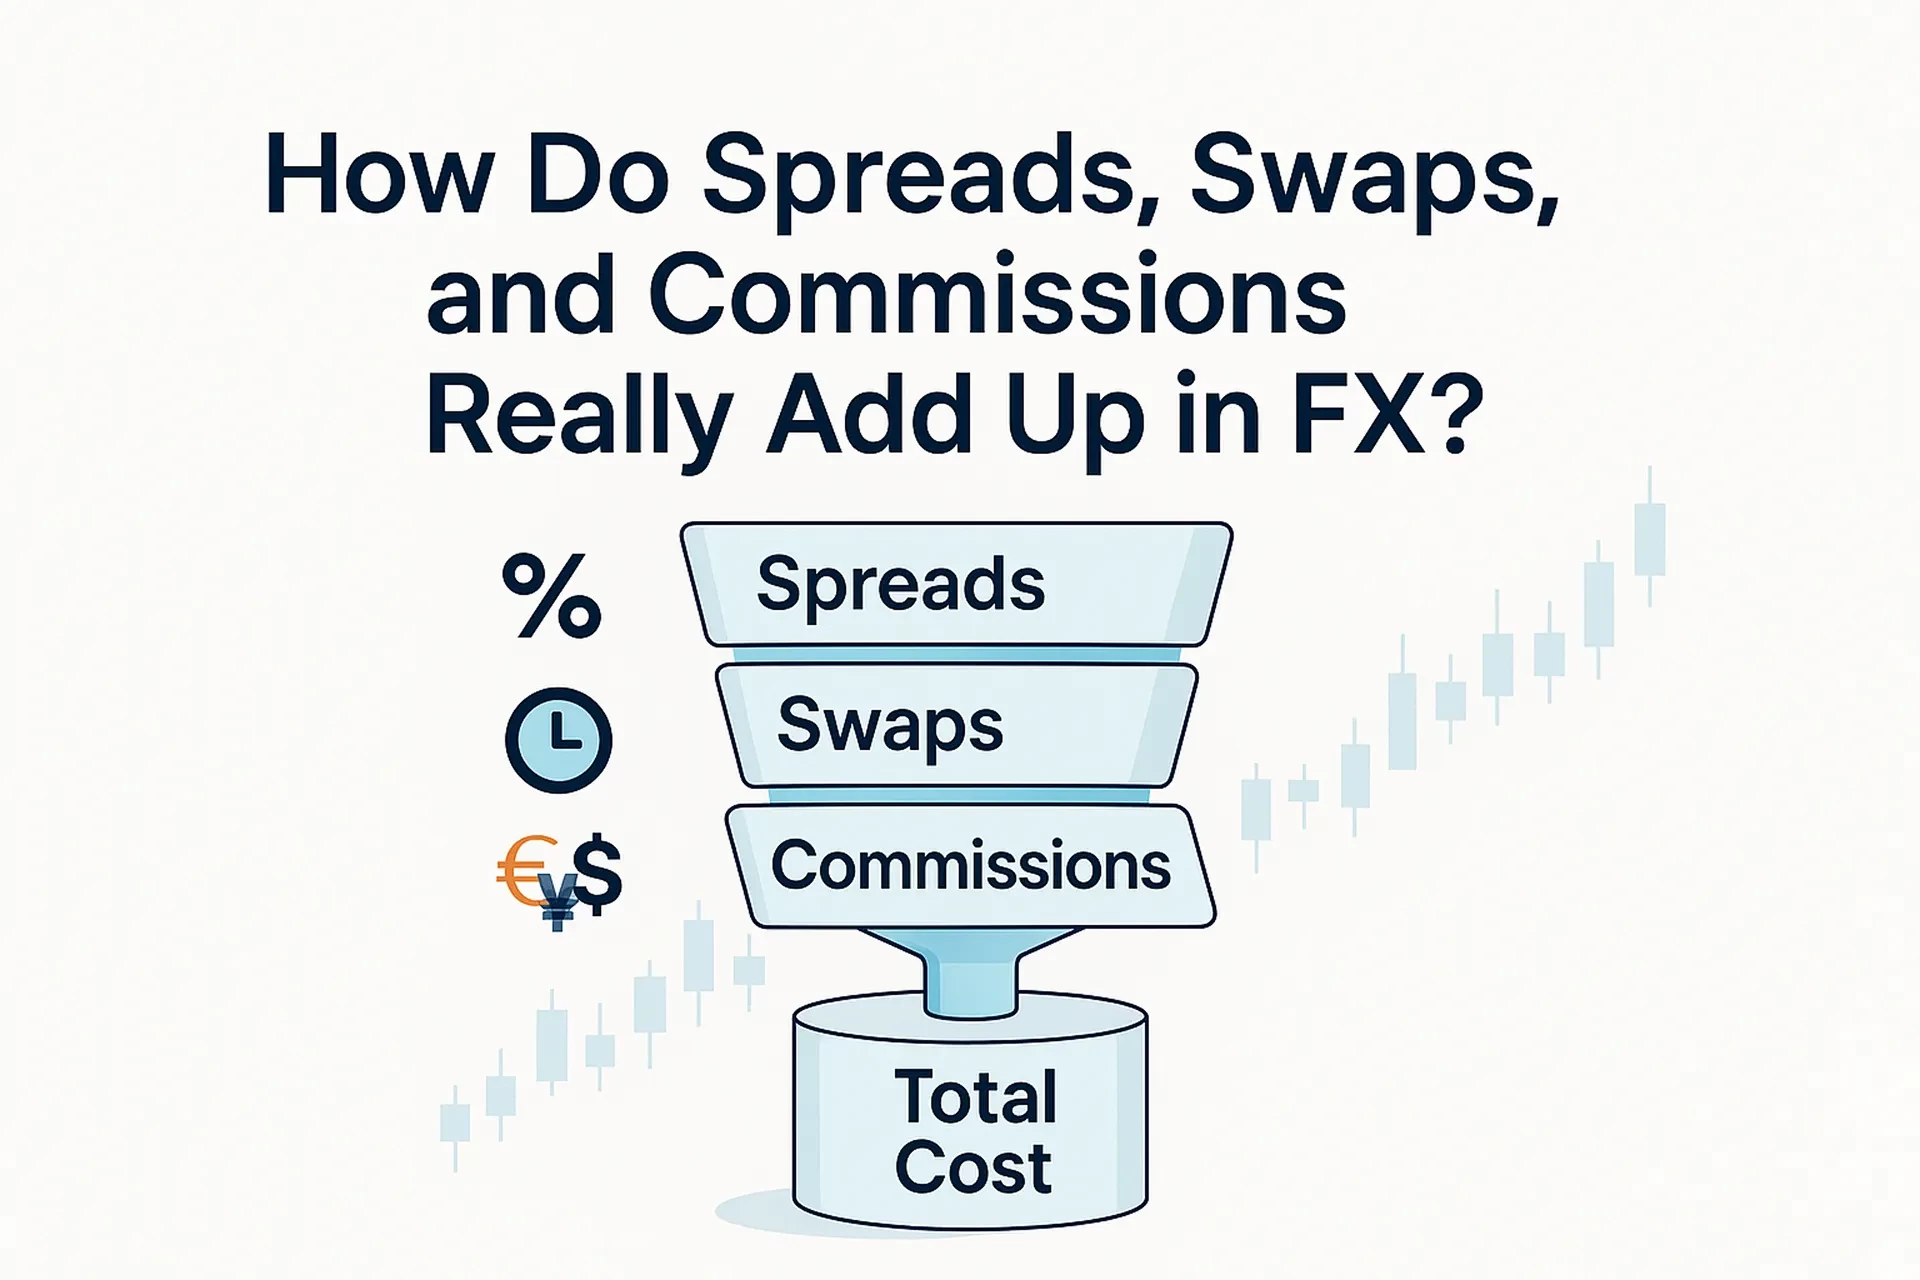
• Liquidity costs—spreads, slippage—compound invisibly, especially during news breaks and in thin books.
2) Execution frictions (E).
• Market impact, routing, queue priority, borrow fees in shorting, and financing charges grind expectancy lower even when your idea is right.
3) Accounting for risk (A).
• Many traders mis-specify position size relative to volatility, then over-concentrate. A few bad trades drive terminal wealth.
• Under margin rules, violations can trigger trade restrictions and forced liquidations that crystallize losses. (FINRA, 2024–2025)
4) Kahneman-style biases (K).
• Loss aversion, FOMO, and disposition effects (cut winners, ride losers) worsen outcomes—especially with real-time P&L and social feeds amplifying emotion. SEC investor education warns that fast, leveraged trading is sophisticated and risky. (SEC, 2025)
A simple expectancy check (so you can test your edge)
Expected value (EV) per trade:
EV = p × W − (1 − p) × L − C
where p=win rate, W=average win, L=average loss, C=per-trade costs (spreads, fees, borrow, financing).
| Win rate (p) | Avg win (W) | Avg loss (L) | Costs (C) | EV/trade |
|---|---|---|---|---|
| 52% | $100 | $95 | $8 | -$0.60 |
| 55% | $100 | $95 | $8 | +$1.25 |
| 45% | $150 | $100 | $10 | +$7.50 |
One-sentence takeaway: Tiny differences in win rate or costs flip your edge from positive to negative—cost control is strategy.
Step-by-step: a risk-first plan to stop leaking P&L
• Define your sandbox (products, hours, volatility).
Trade only products you understand—equities, listed options, or futures with transparent rules and sufficient liquidity. Read the relevant rulebooks and risk disclosures first. (CFTC/NFA/FINRA, 2024–2025)
• Quantify your edge before live risk.
Backtest or forward-test with realistic fees and slippage. Demand a margin of safety: aim for gross EV at least 2× your estimated frictions.
• Position sizing by volatility, not gut feel.
Risk a fixed fraction of capital per trade (e.g., 0.25–0.50%). Set stops from market structure (ATR, recent swing), then size shares/contracts so the dollar risk fits your limit.
• Respect margin and PDT constraints.
If you day trade equities frequently, understand the $25,000 PDT minimum equity and buying-power rules; don’t bounce around restrictions. (FINRA Rule 4210 & guidance, 2024–2025)
• Tighten execution.
Avoid the open’s first minutes unless your edge is open-driven. Use limit orders where appropriate; pre-define slip tolerances.
• Automate risk checks.
Daily max loss (e.g., 1–2R), weekly stop-trade triggers, and cool-off timers after a sequence of losses. “Kill switch”: flatten all at a pre-set drawdown.
• Avoid scams and unregistered “signal” rooms.
The CFTC warns about social-media schemes, AI-bot “guarantees,” and romance-investment scams; if someone promises “consistent high returns” or asks you to move money off-platform, disengage. (CFTC, 2024–2025)
• Tax and recordkeeping hygiene.
Track wash sales, Section 1256 contracts, and financing costs so your P&L is not illusionary. Consult a qualified tax pro.
Practical mini case study: why a “good” scalper still finishes negative
• You scalp a liquid ETF 10 times/day.
• Before costs: 53% win rate; avg win $12, avg loss $11.
• Costs per round trip: $0.005/share commissions × 200 shares = $1, plus $3 estimated spread/slippage → $4.
• EV (gross): 0.53×12 − 0.47×11 = 6.36 − 5.17 = $1.19.
• EV (net): $1.19 − $4 = −$2.81 per trade.
• Daily P&L expectation: 10 trades → −$28; a bad week of volatility spikes pushes slippage to $6 and your edge collapses further.
Lesson: You don’t need to be “wrong” often to lose money—you just need a small, fragile edge plus real-world frictions.
Common mistakes that quietly raise your loss odds
• Trading size, not signal quality.
• Anchoring to P&L goals instead of process metrics (setup quality, rule adherence).
• Over-reliance on borrowed rules from influencers or vendor bots—CFTC has explicitly warned that “AI won’t turn trading bots into money machines.” (CFTC, 2024)
• Ignoring structural protections: If you trade futures or options, understand clearing and customer-fund protections—and the debates around new retail direct-clearing models that may reduce some protections. (NFA Annual Review, 2024)
Expert tips
• Compress decision space. Trade one or two repeating patterns; fewer decisions → fewer errors.
• Journal like an engineer. Track pre-trade plan, post-trade outcome, and what broke.
• Sharpen your entry clock. If your edge is session-dependent, trade only in that window.
• Costs are a strategy. Negotiate commissions, choose tighter-spread instruments, and avoid times of poor liquidity.
U.S. compliance landscape you should actually know
• SEC (securities)—Investor education warns that day trading is fast, leveraged, and risky; be cautious with margin and extended-hours liquidity. (SEC, 2025)
• FINRA (broker-dealer SRO)—Pattern Day Trader requirements under Rule 4210; ongoing 2024–2025 retrospective review of PDT framework; comment letters from industry and state regulators show the rules are active policy. (FINRA, 2024–2025; SIFMA/NASAA, 2025)
• CFTC & NFA (derivatives, retail forex, certain digital-asset derivatives)—Enforcement highlights (2024) and advisories (2024–2025) emphasize fraud risks, unregistered solicitations, and misleading “guaranteed returns.” (CFTC, 2024–2025; NFA rules)
Pros, cons, and risk management—made concrete
Pros of active trading
• Potential to express short-term views and manage risk tactically.
• Diversification of strategies (mean-reversion vs. breakout), low correlation to long-only exposure.
Cons
• High failure rate without a demonstrable edge.
• Meaningful time, focus, and tooling commitments.
• Leverage risk and rule complexity (PDT, margin calls). (FINRA, 2024–2025)
Concrete mitigations you can implement this week
• Cap daily loss at 1–2R; stop at “max pain” or after three consecutive policy violations.
• Trade small until your 30-trade sample shows positive EV after costs.
• Run a “synthetic slippage” stress test: revalue your past month with +2 ticks slippage—do you still make money?
• Scam firewall: no funds to unregistered entities; independently verify registrations (BrokerCheck/Investment Adviser Public Disclosure/NFA BASIC). (SEC/FINRA/NFA, 2025)
Why the majority lose: evidence in 2024–2025
• Regulatory signals: The SEC continues to warn that day trading—often on margin—is fast, speculative, and risky for most investors. (SEC, 2025)
• Rules under review: FINRA’s 2024–2025 re-examination of PDT requirements, with comment letters in Jan. 2025, shows ongoing concern about investor harms and systemic risk. (FINRA/SIFMA/NASAA, 2024–2025)
• International data points: SEBI’s 2024–2025 studies show 70–91% of frequent intraday/derivatives retail traders lose money over multi-year windows. (Reuters, 2024–2025)
• Market-wide dynamics: BIS 2024 work documents margin-call cascades and retail stress during volatility episodes. (BIS, 2024)
Inference for U.S. traders: Even if U.S. datasets differ, the mechanisms that drive losses—leverage, costs, volatility clusters, and behavior under stress—are universal.
FAQ
Conclusion: how to trade without becoming part of the statistic
• Demo/backtest first. Prove positive net expectancy after realistic costs and slippage.
• Institutionalize risk. Daily/weekly loss limits, volatility-based sizing, and a hard kill switch.
• Stay inside the rules. Know PDT/margin and your product’s rulebook; when in doubt, ask your broker’s compliance desk. (FINRA, 2024–2025)
• Educate continuously. Use SEC/FINRA/NFA/CFTC resources; avoid unregistered “gurus.” (SEC/CFTC/NFA, 2024–2025)
Risk disclaimer (plain English): Trading involves the risk of loss, including the possible loss of all the money you invest. No strategy guarantees profits. Use leverage cautiously, understand margin rules, and consult qualified professionals for legal, tax, and financial advice.

